| Zero dimensional, zonal, and spatial models
of carbon and nitrogen cycle for the atmosphere - ocean system were consequently
developed by A.M Tarko together with E.P Novichikhin, E.I. Nefedova and V.S.
Pervanyuk. Here are the results of a spatial model investigation.
1. Description of the carbon cycle model
Three vertical layers are allocated in the
ocean: well-mixed layer (WML), thermocline with variable depth, and deep
layer. The border between thermocline and deep ocean is fixed.
All the ocean area is subdivided to cells
4x5o in size. Based on this, the cells of WML having identical
directions of meridional or zonal horizontal speeds of ocean water are
aggregated in blocks. The sizes of blocks are 8o in latitude
and about 20o in longitude. The deep layer is supposed to be
as one block.
The model variables are the values of carbon
concentration in each block of ocean and values of mass of carbon dioxide
in each zone of the atmosphere. In each WML block the following factors
are taken into consideration: water and air temperatures at the sea level,
salinity of water, speed of water flows between boundaries of the blocks,
speed of the wind. The time unit is one month.
In the model, one-level vertical atmosphere
is divided into 20 zones on latitude from South Pole up to the North. It
is taken into account that the flow of carbon dioxide between zones in
the atmosphere is proportional to difference of its concentrations.
Carbon exchange between blocks within one
level of ocean depends on water circulation. The field of speeds of water
is given on boundaries of blocks for each month.
Exchange between WML and thermocline we describe
according to B.A. Kagan and V.A. Ryabchenko. Carbon exchange between WML
and thermocline is carried out during seasonal raising and lowering of
its boundaries.
The flow of carbon dioxide at the atmosphere
- ocean border is considered to be proportional to the difference between
the partial pressures of carbon dioxide in the air at the sea level and
in the upper layer of ocean. It also depends wind speed. The partial pressure
of carbon dioxide in each zone of atmosphere is proportional to mass and
temperature of carbon.
The dependence of partial pressure of dissolved
carbon dioxide on the concentration of inorganic carbon in WML, temperature
and salinity of sea water in WML is determined on the basis of solving
the system of equations for constants of chemical balance of ocean buffer
carbonate system.
In order to calculate the greenhouse effect
of air carbon dioxide we use values of air temperature from general circulation
models (GCM). The value of atmospheric temperature at a sea level depends
on the seasonal component and the annual change of temperature. Annual
change of the sea level temperature we set to be equal to change of air
temperature.
2. Biotic components
The nitrogen cycle is considered in order to
describe biotic processes in the ocean. In a WML, having a sufficient value
of light intensity, the inorganic carbon and nitrogen transfer to their
organic form as a result of photosynthesis. The net primary production
of phytoplankton depends on the concentration of inorganic nitrogen and
the temperature and does not depend on carbon concentration. We use the
phyto-zooplankton equations to describe the seasonal variability of organic
carbon in the sea. The main part of organic matter is decomposed in WML.
The rest of organic matter falls to deeper layers and then is decomposed
in it.
3. Complete model
The seasonal dynamics of the spatially distributed
carbon and nitrogen cycle in the atmosphere - ocean system is described
by a system of the ordinary nonlinear differential equations with periodic
coefficients.
We assume that in absence of anthropogenic
emissions of carbon dioxide to the atmosphere the quantity of carbon in
the atmosphere - ocean system remains constant. We also consider that during
the pre-industrial period the system was at a steady state.
4. Results of modeling
The computer program, which realizes the model
works under the control of Windows 95/98. Dynamics of carbon cycle was
investigated in the absence and presence of anthropogenic influences. Initial
values of the variables were set, and a system of differential equations
was numerically integrated to receive a periodic solution. The period is
equal to one year.
The values of variables describing carbon
cycle in the ocean are different in latitudes and inside any latitudinal
zone. Increase of carbon concentration in the ocean with depth is observed.
It can be explained by the presence of biota in WML and a permanent lowering
of the dead organic matter to the deep layers.
In WML, the seasonal fluctuations of concentration
of carbon are taking place. The largest amplitude of such fluctuations
is observed in the latitudinal zone between 30o N and 60o
N. Increase in carbon concentration from the equator to the poles is markedly
expressed. Differences of concentration between equator and poles are significantly
greater than seasonal fluctuations in any block of ocean. These results
correspond to the data of measurements.
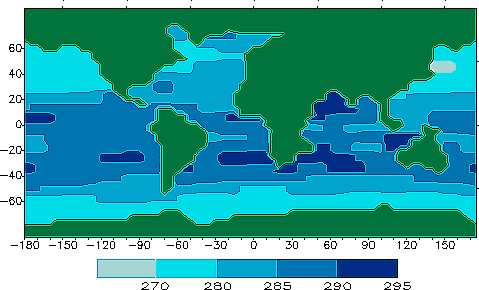
At the figure the distribution of the partial
pressure of carbon dioxide which is dissolved in WML in January is shown.
In contrast to concentration of carbon, the highest values are observed
at the equator and low latitudes. Towards the poles, the partial pressure
of dissolved carbon dioxide is decreased. The maximal values are displaced
from the equator to the South Pole in the summer months and from equators
to the North Pole in winter months. The annual difference of partial pressures
values is 30 ppm.

Map of partial pressure of CO2 in WML in January (ppm)
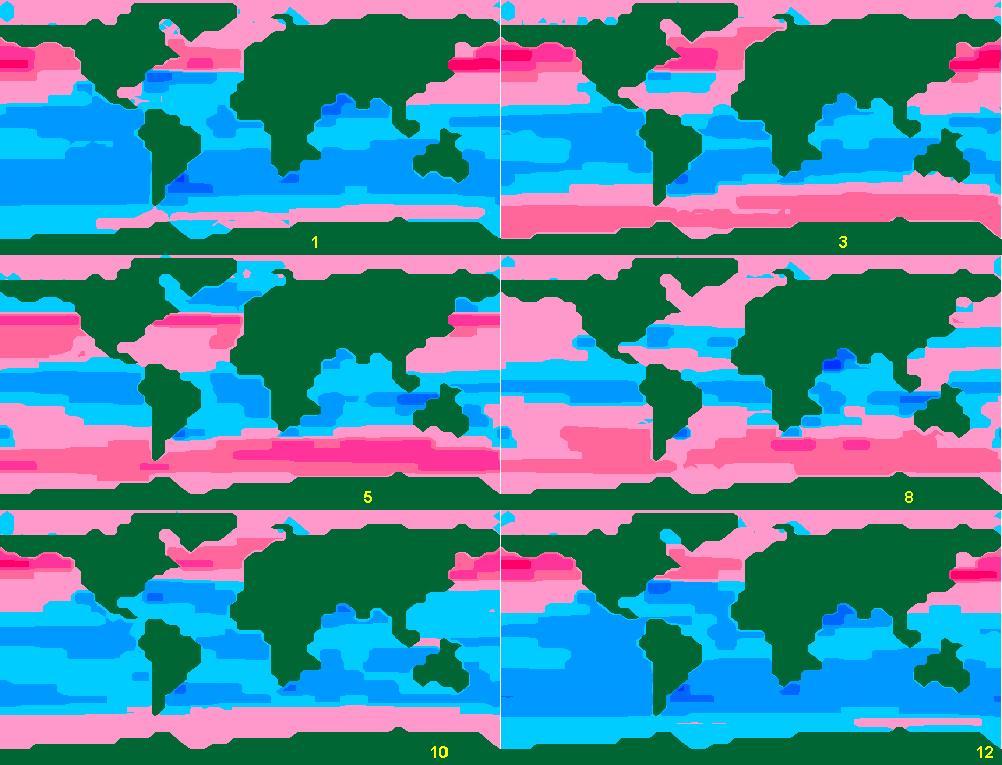
Distribution of seasonal carbon dioxide flows
through boundary atmosphere - ocean is presented at the next figure. Zones
where absorption of carbon dioxide takes place are in high and moderate
latitudes, and in different oceans the absorption occurs differently. In
all the oceans carbon dioxide emissions are located near equator.


Computer animated map of seasonal carbon dioxide flows through the boundary
atmosphere - ocean ( g C/m2
month). Positive values correspond
to carbon dioxide absorption by ocean
Simulating of the consequences of instant releases
of carbon dioxide into the atmosphere was done. Such experiments give an
opportunity to investigate potential ability of the ocean to absorb the
anthropogenic emissions of carbon dioxide. As result of emission, the ocean
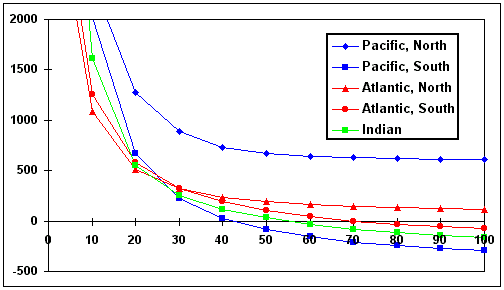
absorbs CO2. Computing experiment in which the amount of atmospheric
CO2 was instantly increased by 10 % was made. The results are
shown in the figure. Absorption of carbon dioxide by different oceans is
presented. All the oceans during the first years after the release are
carbon dioxide sinks. The most powerful absorbers are the Northern part
of the Pacific and Atlantic oceans. The oceans of a Southern Hemisphere
absorb carbon dioxide during the first years after release and then, after
several decades, become to emit CO2. The Southern Hemisphere
part of the Pacific ocean in 40 years after the release becomes the first
CO2 releaser. Then in 55 years the Indian ocean, and in 70 years
the Southern part of the Atlantic ocean begin to emit carbon dioxide.

Absorption of 10 % instant release of carbon dioxide to atmosphere
by different oceans. The flows of CO2 are shown (g C/m2
year)
|


