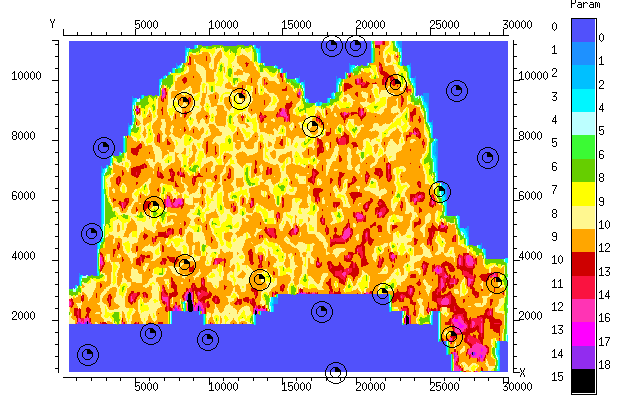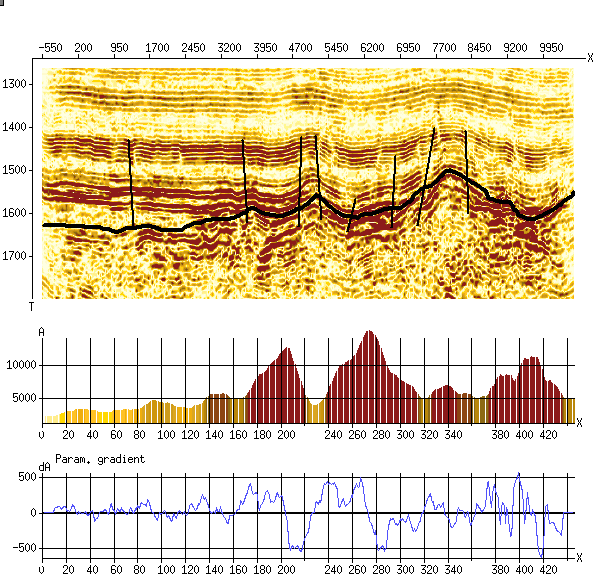
Following picture appears in the visualisation window :

Colorcoded diagram under the seismic section picture -

is calculated parameter value diagram and the curve under it -

is the absolute gradient value of the calculated parameter.
The section picture may be zoomed for more detailed visualisation or colorcoded in another way. In that case the diagram and the curve will be zoomed too.
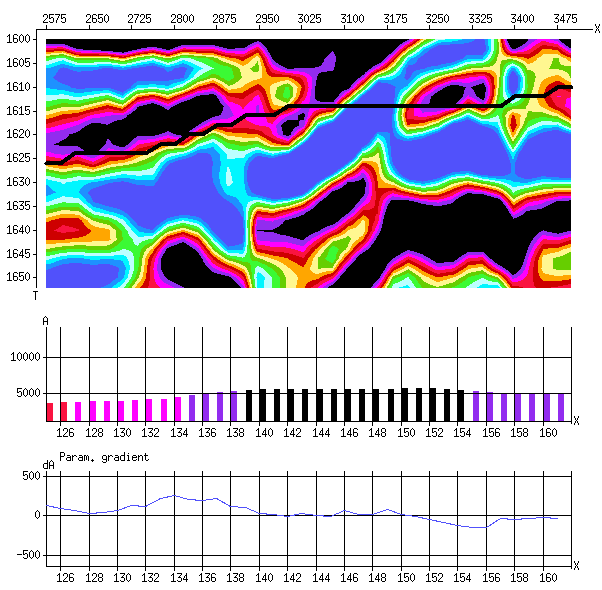
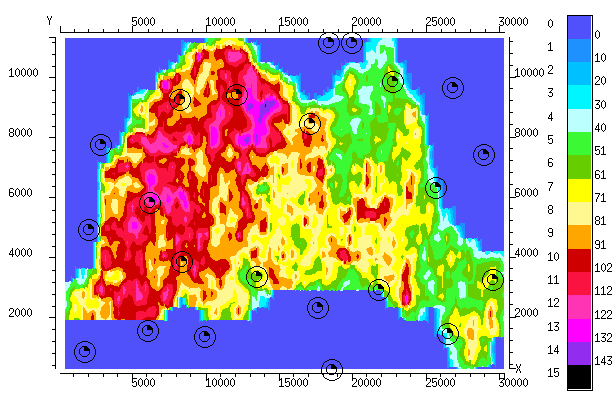
The final results of parameter calculation procedure is a map of calculated parameter version. GERMES-3 visualisation instruments allows to display such maps. There are some maps, (for 3-D procedures), shown below to illustrate this. (Parameter was calculated for some horizons for the Northern "cube" of PRIOBSKAYA area)
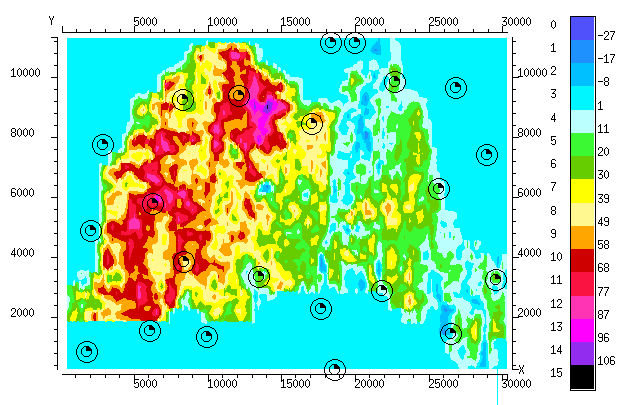
AC112 horizon. Average values in a window with following dimensions:
window height = 3, (discrete in T direction);
window width = 3, ( traces in X direction);
window shift = 0, (discrete in T direction);
window thickness = 3, ( traces in Y direction);
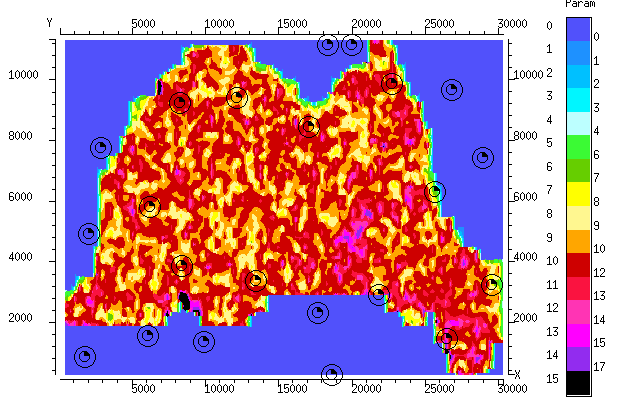
AC112 horizon. Maximum values in a window with following dimensions:
window height = 5, (discrete in T direction);
window width = 5, ( traces in X direction);
window shift = 0, (discrete in T direction);
window thickness = 5, ( traces in Y direction);
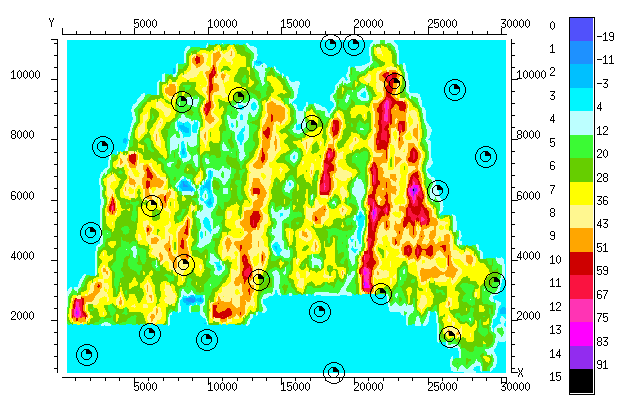
AC102 horizon. Surface gradient in a window with following dimensions ( standard dimensions for this function )
window height = 1, (discrete in T direction);
window width = 3, (traces in X direction);
window shift = 0, (discrete in T direction);
window thickness = 3; (traces in Y direction);
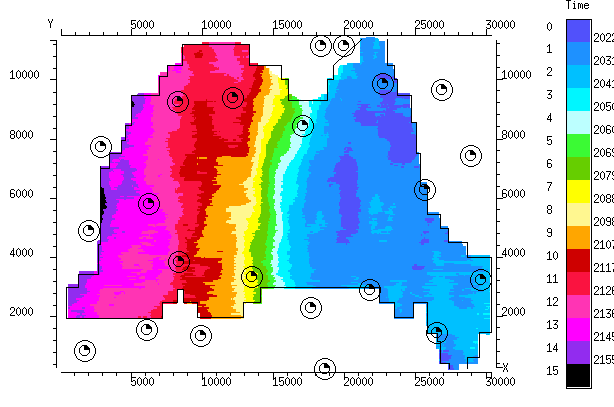
AC112 - AC122 horizons. Parameter calculated in the between horizon space. Average values in a window with following dimensions:
window height - varies from window to window according the current distance between horizons, (discrete in T direction);
window width = 3, (traces in X direction);
window shift = 0, (discrete in T direction);
window thickness = 3; (traces in Y direction);
Time map :
Maximum amplitude map in a 5x5x0x5 window:
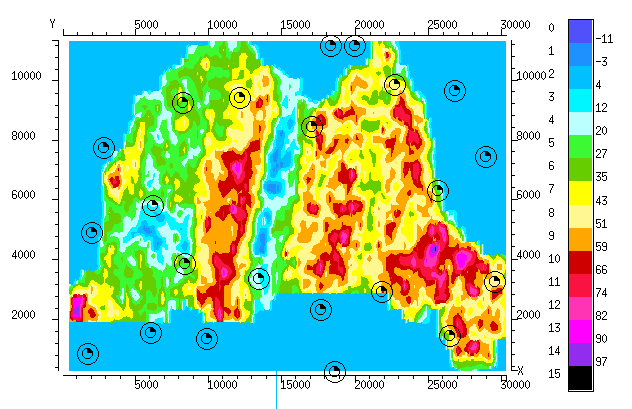
Surface gradient map in a 1x3x0x3 window:
