ChartLib can be used for dynamically refreshed charts on web-sites as PNG, JPEG, or GIF images.
ChartLib can be easily ported into UNIX.
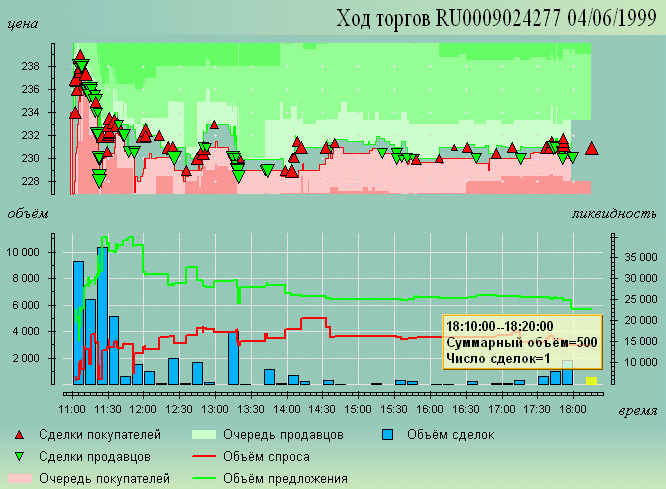
From 1999 up to now the commercial version of ChartLib is used to generate charts on the site of Moscow Interbank Currency Exchange (MICEX), including the MICEX main page!
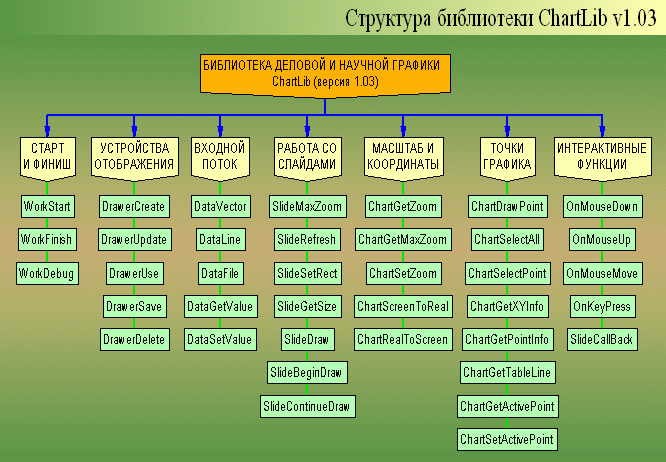
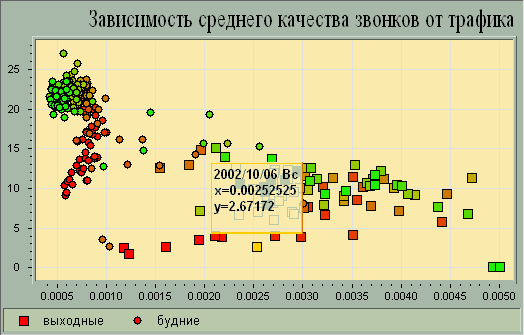
ChartLib supports a variety of two-dimensional charts: scatter plots, plots with any combinations of points, lines, and filled polygons, charts with discontinuous X-axis as multi-days charts, vertical and horizontal histograms, candles, graphs.
ChartLib has its own input format CHD (CHart Description). This is a text file with usual tab-delimited representation of data and command lines that are used to format the chart, see axamples). More than 150 commands are supported, see the Glossary of commands). More than 50 properties of points are supported. Build-in calculator allows to plot functions by formulas and make computations on-fly.
ChartLib outputs chart on window, to printer, in clipboard, or to image file BMP, EMF, PNG, JPEG, GIF. The recommended way of importing images into MS Office applications is a clipboard or EMF format.
ChartLib creates the professional design of charts by means of predefined or user-defined styles.
ChartLib supports interactive chart browsing: zooming, shifting, showing points information hints, points selecting, generating a table on selected points with row-in-table — point-on-chart synchronization.
ChartLib supports several chart panels on a slide, with possibility of axes synchronization.
Several charts can be organized into a slide-show.