Usual decision maps technique is rarely used. It is applied in the case of three choice criteria: several efficiency frontiers of two criteria are depicted depending on the value of the third criterion. An efficiency frontier displays an efficient criterion tradeoffs. Changing one efficiency frontier for another, one can see how the increment (or decrement) of the third criterion value influences the efficiency frontier. By this, a decision map helps to understand the efficient tradeoff for three criteria. The curves on a decision map look like the height curves of a usual topographical map, and so one can understand them quite easily.
The IDM is an animated interactive tool for fast display of various decision maps for three, four, five and more criteria. Myriad of static or animated decision maps may be displayed very fast on request. This can be done on the basis of preliminary approximation of the Feasible Set in Criterion Space (FSCS). To display numerous virtual decision maps, we use animation of maps, i.e. display of automatically generated sequences of decision maps. Moreover, matrices of decision maps ande scroll-bar controlled maps can be used. By this, user can receive objective information about the potentialities of choice and criterion tradeoffs in a simple graphic form that may be easily assessed.
To develop a strategy, it is sufficient to identify a preferable feasible combination of criterion values (feasible goal) on display. Then, computer calculates the strategy that leads to the chosen goal (Feasible Goals Method). Important that the identification of the goal is the most simple form of the preference expression.
Consider a regional development problem that is related to the
search for strategies of further development of an agricultural region (see the map).

One needs to allocate the area of two agricultural zones among production technologies and to specify the water release through the dam.
Three choice criteria are used:

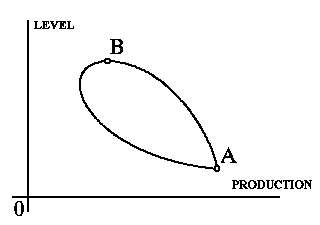
Figure 1. The set of feasible goals and its efficiency frontier
To find a development strategy, a goal should be identified. Usually, the variety of feasible goals is not displayed to user in the framework of goal procedures. This feature can result in a sophisticated question: what strategy should be provided if the goal identified by a is not feasible, i.e. a feasible strategy does not exist that results in the identified goal (this is a normal situation in the goal programming). In this case, a feasible point is computed that is the closest point to the identified goal. A related strategy is computed, too. If the closest feasible combination is distant from the goal, decision maker may be disappointed with the result. Moreover, the feasible point nearest to the identified goal (and the related strategy) may depend more upon the parameters of the distance function than on the goal. Therefore the "closest" feasible combination will disregard the preferences of DM.
To avoid this problem, the varity of all feasible goals can be displayed. In this case, the above problem disappears. The method based on the idea is denoted as the Feasible Goals Method (FGM).
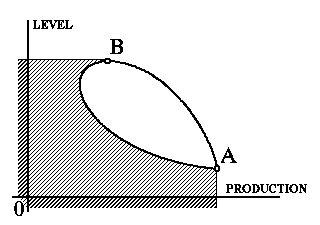
Since the increments of both criterion values (level of the lake and agricultural production) are preferable, the efficiency (non-dominated) frontier of the variety of feasible goals is of interest. It is given in Figure 1 by the curve AB (the "north-eastern" frontier in this case). So, the display of the variety of the feasible goals, along with the description of potentialities of choice, results in the display of the criterion tradeoffs. For example, in Figure 1, the non-dominated frontier shows how the level may be transformed into the production, if the efficient strategies are used. In the case of three, four and greater number of indicators (criteria), the efficiency frontiers can not be displayed so easily. To do it, special technique named the Interactive Decision Map (IDM) was developed. To introduce the concept of the IDM, let us return to Figure 1. Let us modify the picture slightly: a new variety that contains, along with the feasible goals, all dominated (including non-feasible) criterion points is used. In Figure 2, the variety of the additional non-feasible points is shaded.

Figure 2. The Edgeworth-Pareto Hull
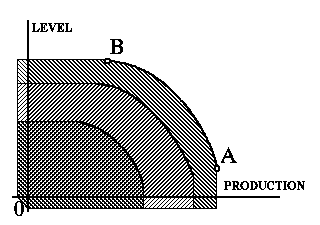
We denote the broadened variety as the Edgeworth-Pareto Hull (EPH) of the set of the feasible goals. Note that the efficiency frontier (the "north-eastern" frontier in this case) of the broadened variety remains the same, but dominated frontiers disappeared. In the case of two criteria, it plays minor role whether the original variety or its EPH is depicted, but it proved to be very important in the case of three and more criteria. Let us consider the case of three criteria, i.e. the water pollution is studied as well. In this case, one may imagine several EPH for two criteria related to different restrictions imposed on the value of the third criterion (pollution is restricted from above by several values). Then, several EPH for two indicators may be superimposed (see Figure 3). The maximal EPH for two criteria is related to the EPH in Figure 2 where no restrictions on the value of pollution was imposed. Important that the efficiency frontiers donot intersect.

Figure 3. The decision map
Collections of the efficient frontiers comprise a decision map. To be precise, in the framework of traditional decision maps, a decision map is comprised of several efficient frontiers while the value of the third criterion takes several given values. We'll make no difference among the traditional decision maps and the decision maps provided by restrictions imposed on the value the third criterion.
Now we are ready to consider the concept of the IDM. In the framework of it, we do not construct the EPH for two criteria. Instead of it, we construct the EPH for three, four, five and more criteria in advance (the formal definitions are given in the next section), and then compute and superimpose the two-dimensional slices of it in the form of decision maps. Since we do not construct a particular decision map in advance, but, in contrast, construct the EPH for all criteria under consideration, we provide an opportunity to display decision maps on request. For three criteria, one may choose arbitrary arrangement of them in the decision map, or one may change the number of the tradeoff curves, or one can zoom a map.
In the case of four criteria, one may display several decision maps in a row. For any decision map in the row, the value of the fourth criterion is not worse than a certain value which can be chosen automatically or by the user. The collection of values of the fourth criterion may be changed easily. Moreover, any criterion may be chosen to be the fourth one.
In the case of five criteria, a matrix of decision maps may be displayed. For any decision map in the matrix, the fourth and of the fifth criteria are not worse than certain given values. The maximal number of rows and columns in a matrix of decision maps depends on display quality and the desire of user. Let us stress once again that a matrix of decision maps can be displayed very fast. An updated matrix of decision maps is displayed in a few seconds after the collections of values of the fourth and the fifth criteria have been changed. Moreover, one can easily change the list of three criteria which tradeoffs are displayed in decision maps. The updated matrix will be displayed in a few seconds as well.
Additional opportunity in the case of four and more criteria is based on the application of scroll-bars which are common in modern software. In this case, we display only one decision map which changes in correspondence to the movements of the thumbs identifying the values of the fourth and the fifth criteria. Though the combination of scroll-bars and matrices of decision maps can be used for display of the EPH for any reasonable number of criteria, we usually restrict the number of criteria by seven. Actually, it is too complicated for a human being to assess the situation in the opposite case. Another opportunity consists in animation of decision maps. Animation is based on the monotonic increment (or decrement) of the value, say, of the fourth criterion. Moreover, animation of a row or of a matrix is possible, too (in this case, the value of the fifth criterion is changed step by step). All these opportunities are related to the fact that the EPH was constructed in advance. Note that on display, the decision maps are depicted in display in color.
We hope that the application of the FGM/IDM technique in the
regional development problem will be of interest for the reader.